INSIDE MARCH MADNESS MANIA
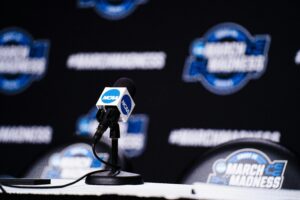
As we gear up for the much-anticipated NCAA basketball tournament, March Madness, it’s fascinating to reflect on how media coverage and sponsorship have shaped its viewership over the years. From its modest beginnings in 1979 to its current status as a cultural phenomenon, the tournament has undergone significant transformations in its presentation to the public.
The Start
Initially, the tournament rallied attention for showcasing basketball talents like Magic Johnson and Larry Bird in its first national audience in 1979. However, it wasn’t until 1984 that media coverage took off, with marketing and advertisements becoming prominent features throughout the tournament. This led to the coining of the term “March Madness” and the branding of tournament rounds such as the Sweet 16, Elite 8, and Final 4, amplifying the excitement surrounding the event and foreshadowing the rise of future basketball stars.
The Last Decade
Fast forward to 2014, when CBS and Turner Sports secured broadcasting rights for a stunning $10.8 billion over 14 years. In their inaugural year, the tournament’s first and second rounds brought in nearly 9.8 million viewers, with over 20 million tuning in for the National Championship game (Ampersand). This partnership marked a turning point, catapulting March Madness into the realm of big-budget sports entertainment.
In 2023 alone, CBS and Turner Sports raked in over $1 billion in ad revenue, signifying the commercial appeal of the tournament (Ampersand). This influx of viewership has paved the way for many sponsorship opportunities, with major international brands eager to associate themselves with the NCAA.
The Present
In 2024, accessibility to the games has expanded even further through various channels, assuring that fans can follow their favorite teams with ease. The drama captured by the media is what keeps fans coming back year after year, and with the path March Madness is currently on, there’s no sign of it slowing down anytime soon.
Total viewership for NCAA March Madness championship games (YoY growth) according to Sports Media Watch:
- 2011 – UC-BU (CBS) – 20.1M (↓ 16%)
- 2012 – UK-KU (CBS) – 20.9M (↑ 4%)
- 2013 – UL-UM (CBS) – 23.4M (↑ 12%)
- 2014 – UC-UK (CBS) – 21.2M (↓ 10%)
- 2015 – DU-UW (CBS) – 28.3M (↑ 33%)
- 2016 – VU-UNC (TBS) – 17.8M (↓ 37%)
- 2017 – UNC-GU (CBS) – 23.0M (↑ 30%)
- 2018 – VU-UM (TBS) – 16.5M (↓ 28%)
- 2019 – VTU-TTU (CBS) – 19.6M (↑ 19%)
- 2021 – BAY-GON (CBS) – 16.9M (↓ 14%)
Learn more about Out-of-Home advertising here.

It wasn’t until 1984 that media coverage took off, with marketing and advertisements becoming prominent features throughout the tournament. This led to the coining of the term “March Madness”
Contact Us


